Preliminary GPU Acceleration Data Indicates Significant Speedup of Hypothesis Update Operations

Intro

In the typical Monty experiment, hypothesis processing during evidence updating is a significant bottleneck. For each new observation, every location on every object model in every LM needs to be compared against and considered in a series of complex operations. Multithreading support exists for object models within an LM, though the LMs themselves are evaluated sequentially, despite being conceptually parallel operations.

Currently the entire Monty system runs on CPUs, which are designed to be able to run a variety of sequences of operations with complex branching structures. Though when it comes to parallelization, CPUs struggle to support the throughput of processing large amounts of data. Even multicore CPUs with multithreading support can support only a max of a few dozen threads in parallel. GPUs, which consist of SIMD (Single Instruction Multiple Data) processors are designed to run a more limited set of operations but on a large amount of data, supporting thousands of threads at once. Therefore, when looking to accelerate a workload on GPUs, the key is to identify ways of structuring the problem such that there are large blocks of data being processed with the same operations.

In Monty, the clear candidate for GPU acceleration is hypothesis processing for evidence updates. Conceptually during a Monty step, all LMs that are not dependent on each other can run in parallel. Within an LM, each object model can run in parallel. Within the update of a single object model, the operations performed across the hypotheses have dependencies but can largely run in parallel. Viewed as one system, a Monty step consists of the same operations processing a large number of hypotheses, which is perfect for GPU acceleration.

This led me to investigate the potential of running the hypothesis update steps for all hypotheses across all LMs as a single GPU dispatch per operation. I selected several of the hypothesis update operations, and wrote custom CUDA kernels to run these operations across all hypotheses at once.

Method

There are seven GPU kernels that I present findings for here: displacement, pose transformation, distance calculation, pose evidence, angle calculation, radius evidence max, and evidence aggregation. More details included at the end.

Refactoring the Monty codebase to use this single-dispatch approach would be challenging. Instead, as a starting proof-of-concept, I created sub-classes of the HypothesesUpdater and HypothesesDisplacer classes that add trace capture features to save the input/output data of each operation. Then in a separate, stand-alone script I profile and verify the GPU kernels against the CPU implementations.

During trace capture, I consider a unique trace to be an LM and object model pair. For each trace I record the experiment step, so that in the profiling script I can group all traces from each step to run as a batch. In these benchmark experiments each of the LMs connected to the same sensor module are being given the same observation at each step. Therefore the evidence update operations within each step can all run in parallel, but hypothesis updates from one step will affect the next step, preventing further parallelization outside the step boundary.

The standalone script performs performance profiling and verification of the batched GPU kernels against the default CPU implementations. Verification compares the results for each hypothesis in each trace between the two implementations, ensuring they are within a tolerance of 1e-5. To generate performance data for the CPU implementation, each operation is run sequentially over each trace in the step and the compute time is measured. The overall CPU runtime for a step is the sum of the individual trace runtimes within the step. This is of course not accurate to Monty’s current multithreading implementation of evaluating multiple object models within an LM. Likely, there is more CPU parallelization that could be achieved on top of this. However, for benchmarking in this standalone script, it would be hard to accurately measure multi-threading performance, so I stick to this simple performance profiling method for preliminary results.

For the GPU implementation, I stack the data from each trace within a step into single tensors, which are fed as input to the CUDA kernels. Each operation runs as a single kernel dispatch over the entire set of hypothesis data across all traces in that step. The runtime for the GPU implementation is the compute time this single dispatch takes to complete.

Benchmark Experiments

The four benchmark experiments that I have captured trace profiles from are base_config_10distinctobj_dist_agent, randrot_noise_10distinctobj_5lms_dist_agent, base_77obj_dist_agent, and randrot_noise_77obj_5lms_dist_agent. I targeted these to get a variety of object counts and LM counts for a variety of trace sizes. I don’t capture the entire experiment, as the amount of trace data would be extreme, instead I capture the first 500 traces per LM.

Caveats

I only profile the raw compute time of the kernels, not the memory operations on either side, which can be substantial. This was a straightforward way to get preliminary results comparing the compute time spent between the two approaches. In practice, there will likely be significant overhead in synchronizing the LMs for one dispatch and the memory operations involved in launching the kernel (CPU-GPU memory transfer, coalescing data from multiple LMs etc.). However, there are also many ways that we could mitigate the overhead of these factors, so it is difficult to get an accurate read on their impact at this early stage.

Further, the kernels I report here are not perfect and are still a work in progress. In particular, the custom distance kernel and pose evidence kernel still have inaccuracies to be debugged further. The custom distance kernel is accurate only to around 0.1 tolerance, while the pose evidence kernel is off by 0.5 for a subset of hypotheses. Also, I couldn’t quite crack the stacked KNN kernel yet, so I won’t report it here. On top of fixing the issues with the existing kernels, I know that we can optimize these PoC GPU kernels further. There are several parts of a few kernels that are quite inefficient, I just haven’t had the time to improve them. It is important to recognize these caveats to the numbers I present here: no LM synchronization overhead, no memory overhead, no CPU multithreading, and kernel bugs, among others.

All of these characteristics of the actual workload will have a significant impact on runtime, and I welcome any feedback about what steps we should take to investigate these problems next. For now, what I have are these raw compute numbers. Take them with a grain of salt, but they still indicate strong potential for GPU acceleration.

Results

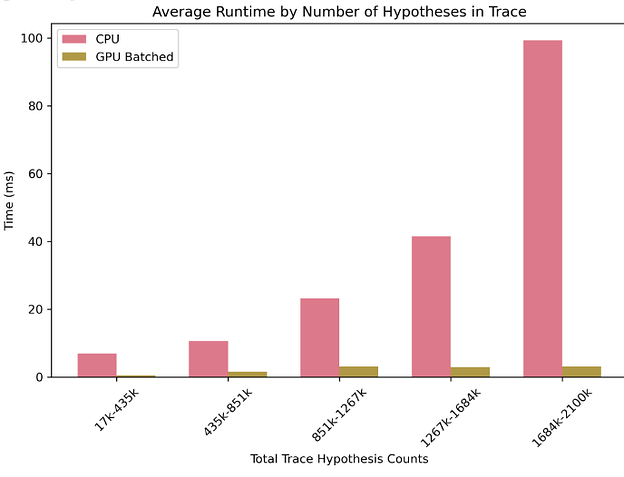
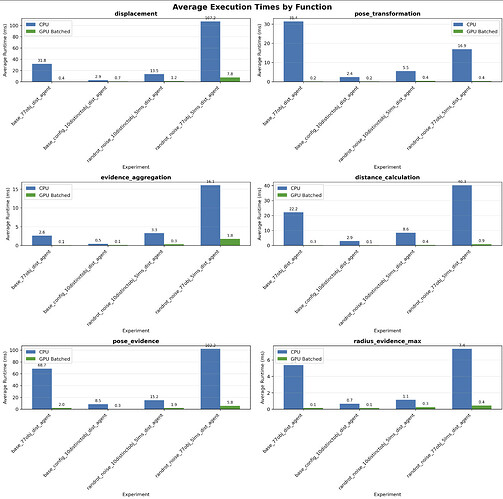
Across the board, the stacked GPU kernels outperform the sequential CPU time by a wide margin. Summing all steps for all traces across the 4 benchmark experiments I captured, the stacked GPU kernel implementation outperformed the CPU implementation by 14.4x Plot 1 below displays the average per-trace runtime in ms of each function per experiment. The speedup multiplier per-trace for each function for each experiment is shown in the following plots 2-5. Finally, plot 6 shows how the GPU and CPU implementations scale as the hypothesis count grows. There is a decent amount of variability in the runtimes, particularly for lower hypothesis counts. This is clear from Plot 1, where the relative runtimes of the different functions is quite different experiment to experiment. Generally, as the hypothesis counts grow, the runtimes become more consistent.

Plot 1: Average Per-Trace Runtime per Function per Experiment

Plot 2: Average GPU Speedup per Function for base_config_10distinctobj_dist_agent

Plot 3: Average GPU Speedup per Function for randrot_noise_10distinctobj_5lms_dist_agent

Plot 4: Average GPU Speedup per Function for base_77obj_dist_agent

Plot 5: Average GPU Speedup per Function for ranrot_noise_77obj_5lms_dist_agent

Plot 6: Average Step Runtime by Total Hypothesis Count

Environment

These experiments were performed on my Windows laptop with these Specs:

  • CPU: Intel(R) Core™ Ultra 9 185H 2.50 GHz

  • GPU: NVIDIA GeForce RTX 4070 Laptop GPU

  • RAM: 32 Gb

Conclusion

While there are significant caveats as context to these performance gains, the gains themselves are substantial and merit further investigation into GPU acceleration of Monty. We need to consider the existing CPU multithreading, the code refactoring necessary to handle the LM synchronization and data processing, and the hardware platforms these will run on. Ultimately, the impact of GPU acceleration within the Monty codebase could look very different than in this stand-alone analysis. Of course, it would be worth our time investigating CPU parallelization further. I know having a CPU backend for Monty will always be an important feature for low-power devices and constrained runtimes. However, for faster research turnaround and benchmarking against traditional deep learning approaches, a faster GPU-acceleration implementation would be valuable.

Kernel Details

The monty_cuda.displacement_stacked kernel implements the first part of the displace_hypotheses_and_compute_evidence() method of the HypothesisDisplacer, where the possible hypothesis poses are rotated by the calculated displacement of the new observation from the previous observation.

The monty_cuda.pose_transformation_stacked kernel implements the spatial_arithmetics.rotate_pose_dependent_features() function where the pose dependent features of the hypotheses are rotated.

The monty_cuda.custom_distance_stacked kernel implements the get_custom_distances() function where the distances, modulated by the point normal and curvature, are calculated between the search locations and their nearest neigbors.

The monty_cuda.pose_evidence_stacked kernel implements the _get_pose_evidence_matrix() method of the HypothesesDisplacer where the pose evidence for the nearest neighbors within the search radius are calculated. See note about monty_cuda.angle_calculation below.

The monty_cuda.angle_calculation kernel implements the get_angles_for_all_hypotheses() function that computes the angles between the hypotheses and their neighbors. Note, this calculation I actually combine with the pose_evidence_stacked kernel as the inputs directly feed into that kernel. All performance and verification data in this post includes monty_cuda.angle_calculation and monty_cuda.pose_evidence together.

The monty_cuda.radius_evidence_max_stacked kernel implements the max operation to select the highest evidence from the search radius for each hypothesis.

The monty_cuda.evidence_aggregation_stacked kernel performs the weighted sum of the current and past evidence for the hypotheses that occurs in the displace_hypotheses_and_compute_evidence() method of the HypothesesDisplacer.

This list of kernels provides a range of complexity for understanding the impact of GPU acceleration, from very simple kernels like the radius evidence max kernel to the more complex operations like the pose evidence kernel. I am still working on a stacked KNN kernel. There are also more operations that would need to be GPU-accelerated, and various conditional edge cases that I haven’t implemented. These kernels are a starting point for generating performance data for most of the core computations involved in the evidence update steps.
6 Likes

I am happy to share the code for this analysis. This seemed more appropriate for monty_lab over the monty repo, but it isn’t open to external collaborators. If interested, please let me know the best way to share the code.

1 Like

Thanks @collin , this is great! I’ll point the research team over here.

Hi @collin

This is amazing! What a great and in-depth analysis! And also very promising results for GPU acceleration. I will have to have a closer look next week (and feel free to just share the code by linking your code repository, no need to open a PR to tbp.monty or monty_lab for now), but I have one question now already:

How big do you see the advantage if we just GPU batch over the object model hypotheses within each LM?

From looking at the results from the 1LM experiments, it looks like those speedups are already significant. I am mostly asking because I think isolating the batching to only within-LM operations would be significantly easier and more in line with Monty’s design principals. LMs are more like semi-independent processing units that run most of their computations internally and then community some of those high-level outcomes with other LMs. Not every LM get’s updates at every step (for instance when connected to the featureChangeSM, LMs often don’t get input because the sensor is not detecting any significant change in features) which might further complicate batching over LMs. It would be nice if we can keep the LMs as relatively independent processes that only communicate some information with each other while taking advantage of this GPU acceleration with each LM. What are your thoughts around that?

One other smaller question I have is what your hypothesis testing setup was (which might be answered if I can just have a quick look at your code). In our default setup, the number of hypotheses tested at each step decreases drastically with each step Monty takes (since their evidence falls below the evidence_update_threshold ). Did you set evidence_threshold_config="all"for those results?

Best wishes,

Viviane

1 Like

@vclay Those are great questions! It is helpful to get a better sense of where you see the parallelization opportunities to be.

I reran the experiments after restricting traces to only the hypotheses within one LM. While this shouldn’t affect the 1 LM experiments base_config_10distinctobj_dist_agent and base_77obj_dist_agent (though there is variation run to run and I see higher gains today, showing again to take the specifics with a grain of salt), the 5LM experiments still see a speedup, but a reduced one: randrot_noise_10distinctobj_5lms_dist_agent goes from an average GPU speedup of 10.5x to 4.24x, while randrot_noise_77obj_5lms_dist_agent went from 17.1x to 13.4x. Generally, these findings stick with the trend of larger speedups for batches with higher hypothesis counts. Shifting from 5LM batching to 1LM leads to a larger number of smaller traces, hurting efficiency, but still seeing a gain.

In my head, I was picturing some level of separation of LMs into groups that can be parallelized and those that can’t, depending on their type and connections. This way LMs that would be running at the same time can benefit from parallelization, but for LMs that would have different runtime behavior we aren’t forcing synchronization. I still think something like this could be feasible, and could keep LMs conceptually separate but have parallelism at runtime, but I’d love to hear your thoughts on how this fits with the broader system architecture.

Perhaps a better approach architecturally to keep LMs separate would be to explore having a different cuda stream for each LM. This could help us keep separate logic and separate kernel dispatches per LM, but the dispatches could overlap their computation on the GPU and still see some cross-LM parallelization gains. There are other architectural decisions to figure out though, this is just a thought.

For your second question about hypothesis testing setup: right now I capture the inputs/outputs for each function separately. So the trace capture for subsequent functions will save the hypotheses after the have been filtered down. However, for an actual implementation in the codebase, it might look differently, where it might be beneficial to zero-out values but still process them rather than having complex indexing or branching logic in the kernels themselves.

Thanks for the thoughts! Happy to discuss in more detail. Let me organize the code a little bit and I will share the repo link in the next couple of days.

1 LM experiments

base_config_10distinctobj_dist_agent

Before

  • Average GPU Batched Time: 0.27ms
  • Average CPU Time: 2.99ms
  • Average Batched Speedup: 11.19x
  • Average Hypothesis Count: 29.70 K hypotheses
  • Total Traces: 300

After

  • Average GPU Batched Time: 0.09ms
  • Average CPU Time: 2.26ms
  • Average Batched Speedup: 24.31x
  • Average Hypothesis Count: 29.70 K hypotheses
  • Total Traces: 300

base_77obj_dist_agent

Before

  • Average GPU Batched Time: 0.50ms
  • Average CPU Time: 26.99ms
  • Average Batched Speedup: 53.79x
  • Average Hypothesis Count: 306.35 K hypotheses
  • Total Traces: 42

After

  • Average GPU Batched Time: 0.26ms
  • Average CPU Time: 23.57ms
  • Average Batched Speedup: 90.53x
  • Average Hypothesis Count: 306.35 K hypotheses
  • Total Traces: 42

5 LM experiments

randrot_noise_10distinctobj_5lms_dist_agent

Before

  • Average GPU Batched Time: 0.75ms
  • Average CPU Time: 7.87ms
  • Average Hypothesis Count: 136.35 K hypotheses
  • Average Batched Speedup: 10.53x
  • Total Traces: 318

After

  • Average GPU Batched Time: 0.41ms
  • Average CPU Time: 1.75ms
  • Average Batched Speedup: 4.24x
  • Average Hypothesis Count: 28.91 K hypotheses
  • Total Traces: 1500

randrot_noise_77obj_5lms_dist_agent

Before

  • Average GPU Batched Time: 2.83ms
  • Average CPU Time: 48.35ms
  • Average Batched Speedup: 17.11x
  • Average Hypothesis Count: 1391.65 K hypotheses
  • Total Traces: 42

After

  • Average GPU Batched Time: 0.67ms
  • Average CPU Time: 9.03ms
  • Average Batched Speedup: 13.41x
  • Average Hypothesis Count: 278.33 K hypotheses
  • Total Traces: 210
1 Like

Added the code this investigation to its own repo here: GitHub - collin-allen512/monty_gpu_poc: Investigation into GPU acceleration of the Monty codebase
It still needs some refactoring and verification, but wanted to go ahead and share the link.

2 Likes

Hi @collin

wow thanks for the quick follow-up! Super interesting. I have a quick question on the before and after numbers you shared:

Do I understand it correctly that “before” represents the case where you batched across LMs whereas “after” represents only batching for operations within an LM? It looks like the “Average GPU Batched Time” actually went down (0.75ms to 0.41ms for 10 objects and 2.83ms to 0.67ms for 77 objects). The reason why the speedup over CPUs was smaller seems to be caused by the “Average CPU Time” reducing more. 1. why are both GPU and CPU time less? and 2. why do before and after have different amounts of traces? I am probably misunderstanding something fundamental.

Generally, I think keeping the batching within an LM would be better. It would be difficult to consistently group LMs by when they process input. Imagine multiple adjacent patches of skin on your finger, each patch connected to a different LM. As you run your finger over an object, some patches will be on the object while others don’t sense anything and hence don’t send input to the LM. The subset of sensor patches that send input to the LM can change from step to step and is not easily predictable. Different cuda streams for each LM sounds conceptually better to me (although I don’t know what that means technically).

Best wishes,

Viviane

1 Like

Great questions, glad I can clarify.

Performance data changes

Yes you are correct about the before/after distinction: before was with a batched step including all LMs, after was with a batched step per LM.

Your response led me to realize that in the above reporting “Total traces” should actually be “Total steps.” The terminology I have been using is to consider a trace an LM-object model pair, and a step to be a full Monty step. However even in the Before case the “Total traces” was actually reporting the total steps for that experiment, not traces. Now that I report per-LM steps, the term “step” no longer exactly corresponds to a full Monty step but instead a per-LM step.

The reason that the average runtime went down for both CPU and GPU implementations is because the number of traces in the batched step went down after we switched to running per-LM steps. In the before case we had fewer steps with larger trace counts and higher per-step average runtimes, whereas in the after case we had more steps with fewer trace counts and therefore lower per-step average runtimes. You can see that the average hypothesis count went down substantially in the after cases. The whole runtime likely went up, but the per-step runtime went down. In general I would expect to see the CPU and GPU runtimes stay closer for smaller trace counts, and the speedup to grow as the trace counts increase (indeed the scaling in Plot 6 demonstrates this trend). Hope that clarifies!

Also worth noting that the runtimes reported even in the 1 LM case change between the Before/After. This is solely due to variation in performance run-to-run. These were identical runs on the same data with the same verification scores, but the runtimes can still differ notably. There are some straightforward techniques we could use to achieve more stable numbers, such as including warmup runs and averaging the profiling data over several trials.

LM Independence

Thank you for adding more context around the unpredictability of inputs going into each LM. With unpredictable combinations of LM step-to-step the GPU implementation would become much more challenging. Generally as the LM-graph gets more complex then generating and maintaining the LM groupings would definitely get complicated. Certainly I see that it would be both conceptually and practically simpler to batch within LMs and not across them, even if there could be some performance gains left off the table.

If anything, focusing on per-LM batching will certainly simplify the code changes needed to support a GPU backend!

3 Likes

Ah okay, I think that clarifies things more (although I still have a question, sorry). Just to make sure I understand it right first: Taking randrot_noise_77obj_5lms_dist_agent as example, we have 42 steps in the before and 210 steps in the after because these are LM steps (after = before*5). Is that right?

The hypothesis count is the opposite (after = before/5), why is that? Shouldn’t the hypothesis count be the same in both cases then? Maybe I am still missing what a trace refers to. If it is an object-model pair (one MontyExperiment episode) and you keep the number of traces constant, shouldn’t the number of hypotheses also remain constant?

And yes, if it is possible to get performance gains only by focusing on per-LM batching (which it looks like it is) then that would be significantly easier and more in line with Monty’s design philosophy :slight_smile:

Yes you are understanding correctly that the total steps (reported above as total traces incorrectly) after = before * 5, because before when we had one step (which was a true Monty experiment step) we now split that into 5 per-LM steps. To address the confusion about the total hypothesis count, the reason this goes down is because it is the average hypothesis count per-step. So before when we had all 5 LMs in one step, we had more total hypotheses in that step. Now that we have separated that single step into 5 individual steps, each one has a lower hypothesis count. Does that make sense?

TLDR the total steps is a sum over the whole profiling run, so it goes up because we split the before steps into more steps, whereas the average hypothesis count is a per-step average, so it goes down once we split the steps into smaller pieces.

The total number of hypothesis remains constant, as does the total number of traces, however I don’t report those numbers in that comment (instead I incorrectly report Total Steps as Total Traces). Sorry for that confusion!

2 Likes

Okay thanks a lot for the clarification, that all makes sense now! Last question to get back to the runtime comparison: Does this mean that for the runtimes between before and after to be comparable we should multiply them by 5? So the runtime refers to the time that one step takes, which, before, was one step of all 5 LMs, and after is a step of one LM?

Yep! All of the average data shown in the After section is for the steps of 1 LM at a time. So the total compute fore the 5 LM runs in the After data should be 5 times the per-LM-step average.

For randrot_noise_77obj_5lms_dist_agent Before was 2.83 ms and after is 3.35 ms (0.67 times 5). Not bad!

For randrot_noise_10distinctobj_5lms_dist_agent before was 0.75 ms and after is 2.05 ms (0.41 times 5). That is more of a slowdown, but still doing well compared to the 7.87 CPU total before.

okay great! Yeah that makes sense that there would be less of a speedup effect if the LM has less objects in memory (i.e. less hypotheses to parallelize over).

I’ve also had a chance to look at the GitHub repo you shared. It’s really nicely organized and documented! I am not an expert with all this, so I would hand it over to @tslominski to discuss whether there is an elegant way to integrate a GPU option into Monty. Basically, we would still want to support Monty’s CPU-only setups, but if CUDA is available, it could use the accelerated GPU functions you implemented to get some extra speedups.

One other question: In your initial post, you mentioned that some kernels (like the custom distance kernel) aren’t totally accurate. Have you had a chance to run a Monty experiment with the GPU-accelerated functions and look at how the accuracy is impacted? Sorry if this is a naive question and it would be a lot of complicated effort to integrate the functions into Monty before you could run such an experiment.

  • Viviane

Great! Glad this makes sense and thank you for the clarifying questions and discussion.

When Tristan and I last discussed this, supporting multiple backends seemed like an option. Only parallelizing within an LM would certainly make this easier to integrate and have a single backend interface. Would love to discuss more and plan steps for integration.

No, I have not had a chance to run a full Monty experiment with the GPU-accelerated functions. The only verification level I have evaluated is comparing the functions individually. Using this testbed I can work on fixing the accuracy bugs, but I don’t see an easy way to evaluate full-system accuracy until we make headway on an implementation.

3 Likes

I finally managed to catch up :slight_smile:.

Thank you for running these experiments, this looks very promissing and the proof-of-concept code is very educational :folded_hands:.

I’m thinking a next step would be to create a minimal prototype of being able to run at least one of the operations from the proof-of-concept with Monty code. We would then evaluate the prototype, and if all goes well, we’d integrate into Monty proper with all (working) operations.

I’m gonna put together some thoughts on a way we might go about this. I’ll create another topic to get into the prototype details.

1 Like

Glad that this was helpful. Implementing a prototype for an operation within Monty code makes sense to me as a next step. Since we seem to have landed on batching only across object models within an LM and not across LMs, I think this implementation could be reasonably straightforward. Looking forward to discussing more.

1 Like

I created the Prototype: HypothesesUpdater operations on CUDA GPUs topic for discussing the prototype.